The manuscript A New Z-Score Curve of the Coronary Arterial Internal Diameter Using the Lambda-Mu-Sigma Method in a Pediatric Population is currently in-press over at JASE. It is an impressive feat from the Japanese "Z Score Project Investigators", involving well over 3,000 normal subjects. I think the data presented within this manuscript is fascinating on many levels.
( Click here to skip ahead to the new coronary artery z-score smackdown or, click here or here to skip over to the coronary artery z-score calculators)
Since we now live in the era after Mawad's Review and Critique of the Statistical Methods Used to Generate Reference Values in Pediatric Echocardiography, I feel like we are kind of obliged to heed their advice when presenting newly proposed z-score equations.
several steps are needed to ensure that no important biases were introduced by the modeling of the response variable, regardless of the regression approach used.
In short, the steps they outline are:
- the regression model should be chosen so that the fit is adequate across the entire population.
- the distribution of the residual values should be inspected.
- heteroscedasticity should be assessed, and when it is present, a model taking it into account should be used.
For the first point, choosing a model such that the "fit is adequate across the entire population" seems to have easily been met in this case. There authors collected and analyzed data on 3,851 patients, ranging from 0 - 18yrs, with a range of BSA from 0.13 to 2.29. Although they do not report patients-per-age-group (or bsa groups), it seems hard to believe they did not have enough patients.
The second point concerning inspecting the residual values, seems to have been met, judging by their prolific use of Q-Q plots, but I'd be a lot happier looking at their z-score frequency distribution plots with a normal curve superimposed on top. Maybe that is what their "density vs. quantile residual" plots are supposed to be showing, but I don't know. The other piece missing from here for my taste is a plot of z-score vs. BSA in order to detect any residual association with body size.
The last of these steps proposed by Mawad concerns an appreciation of, and adjustment for, heteroscedasticity (non-constant variation). Here is where the LMS method used by the authors shines brightly, and they should get high marks for choosing this method of analysis. The authors also provide a handy Excel file for aiding users with the calculations. Very nice.
However, I have a couple of bones to pick with the presentation and possibly the execution (?) of the LMS method. First, the manuscript shows the formula for the z-score thusly:
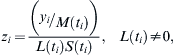
However, in the original Cole and Green "Stat Med" manuscript, the (correct) formula is expressed as:
Hapless readers will have no choice but to make a few calculations on their own and then be surprised and confused by those erroneus results. Only by reading other manuscripts that use the LMS method, and copying their instructions, or by dissecting the supplemental spreadsheet (to see how the authors actually made their calculations) will users be able to correctly apply the data in this manuscript.
Another point that fascinates me about how the authors employed the LMS method is evident in the resulting data tables themselves. Have a look:
| BSA | L | M | S |
|---|---|---|---|
| 0.15 | 0.292 | 1.010 | 0.174 |
| 0.20 | 0.292 | 1.099 | 0.174 |
| 0.25 | 0.292 | 1.187 | 0.174 |
| 0.30 | 0.292 | 1.276 | 0.174 |
| ... | ... | ... | ... |
| 2.15 | 0.292 | 3.671 | 0.174 |
| 2.20 | 0.292 | 3.726 | 0.174 |
The published data for the L and S values do not change. That seems weird to me.
The LMS method summarizes the changing distribution by three curves representing the median, coefficient of variation and skewness, the latter expressed as a Box-Cox power.
Aside: The L (lambda) in the LMS method is the one representing the skew, "expressed as a Box-Cox power"; The M (mu) represents the mean; the S (sigma) represents the coefficient of variation (SD / mean).
The reason these data seem weird to me is that the entire point of the LMS method is that you would employ it in situations where skew and SD's vary and are not easily modeled otherwise; the LMS method is designed to smooth the prediction curves fitting these varying characteristics.
Half of the measurements (males: LMCA, RCA; females: RCA, LAD) are modeled in this way- with the same L and S values. It doesn't seem to make sense: that the LMCA of male patients is invariant in this manner, but not the LMCA of females... that one coronary artery would demonstrate changing skew and variation, but the adjoining segment would not. That sounds to me more like a statistical aberration and less like a physiologic/anatomic phenomenon.
Lastly, the authors go to additional effort to test and compare previous coronary artery z-score equations against their newly developed model. It is particularly fascinating to see that their analysis of the Dallaire and Dahdah equations show them to perform less well— as depicted by their Q-Q plots (sample quantiles vs. theoretical quantiles).
This is a quandry.
Aside: What the authors are calling Q-Q plots appear to be plots of the "sample quantiles" vs. "theoretical quantiles", with the theoretical quantiles being those of the normal distribution. This technique is also known as a probability plot- or in this special case- a normal probability plot.
The unsettling discovery that the data of Dallaire and Dahdah appear to not be normally distributed goes against the entire premise of the Dallaire and Dahdah manuscript. They set out to develop, and then went to great trouble to prove, equations that were valid and normally distributed. Further, they noted that their equations resulted in data that was normally distributed in the arithmetic scale, i.e., they did not need to be transformed, log- or otherwise, to achieve normality.
So, how can it be that one group can set out to design and construct z-score equations that result in normally distributed scores, and another group can demonstrate that very same data to appear to deviate from the normal distribution?
I think it is probably what Kobayashi et al. mention in their limitations section:
our cohort included only a Japanese pediatric population, and therefore it is not generalizable to multiethnic populations in other countries. Further assessment might be needed to determine whether our Z-score models are appropriate for children of other ethnicities.
Or, it could just come down to what Mark Twain may, or may not, have actually said:
There are three kinds of lies: lies, damned lies, and statistics.