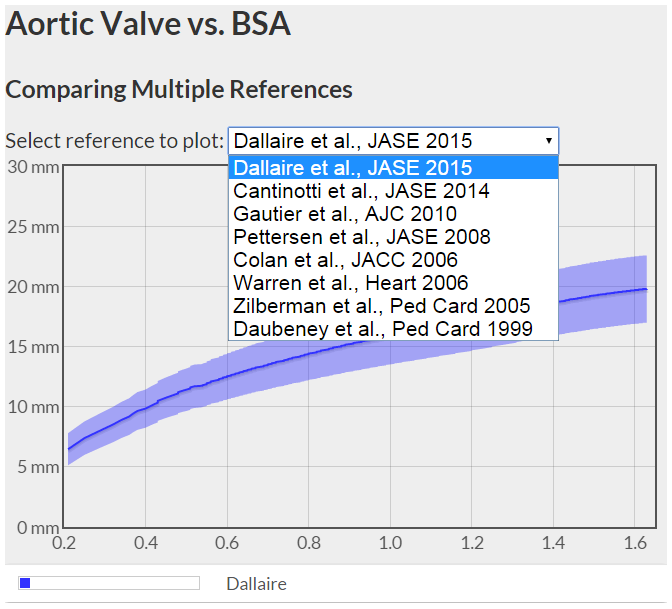
I added new equations for z-scores of the aortic root, based on the recent article, Bias related to body mass index in pediatric echocardiographic z scores. In this article, the authors address the problem of using weight-containing variables (such as BSA) to adjust cardiac structures for body size, particularly in patients who are obese.
Several different bivariate (one independent + one dependent variable) models using height, weight, BSA, and lean body mass (LBM) were tested for (residual) association with BMI. In their testing, all mathematical models, using all of the independent variables continued to have significant associations with BMI. It was only when a multivariable (using height and weight separately) polynomial model that they were able to achieve BMI independence.
The association of higher BMI-for-age Z scores with lower proximal aorta Z scores when normalized for weight or BSA suggests one of two possibilities. Either the dimension of the proximal aorta is actually smaller in subjects with higher BMI-for-age, or the normalization for BSA or weight with bivariate models has introduced a bias.
So, I thought it might be interesting to make a few comparisons.
First, I made another aortic valve z-score smackdown. For predicting the aortic valve "normal range" I used CDC and WHO growth chart data (50th %-ile) to generate a ht/wt/BSA range of "normal" (female) patients:
Secondly, although the range of normal is interesting, the specific problem the current model is designed to address concerns patients with "high BMI-for-age". So I generated a few hypothetical (female) patients and predicted the normal aortic valve for each of them:
| Age (yrs) | Height (cm) | Weight (kg) | BSA (H) | BMI | BMI Z |
|---|---|---|---|---|---|
| 8 | 120 | 39 | 1.16 | 27.08 | 2.46 |
| 10 | 130 | 51 | 1.38 | 30.2 | 2.4 |
| 12 | 141 | 66 | 1.64 | 33.2 | 2.38 |
| 14 | 152 | 78 | 1.85 | 33.8 | 2.2 |
| 18 | 163 | 120.5 | 2.41 | 45.2 | 2.43 |
Finally, I created a single extreme hypothetical case (also female):
| Age (yrs): | 12 |
| Height (cm): | 144 |
| Weight (kg): | 100 |
| BMI: | 48.2 |
| BMI Z-Score: | 2.92 |
| Lean Body Mass (kg): | 45.7 |
| BSA (Boyd): | 2.12 |
| BSA (DuBois): | 1.87 |
| BSA (Haycock): | 2.07 |
and plotted a range of aortic dimensions and the generated z-scores for each dimension and reference:
So, what can we learn from these plots and scenarios? Well, one thing that is apparent to me is the data from Daubeney et al. are grossly removed from what all the others are predicting. The Pettersen et al. data becomes wildly unrealistic for larger patients. People should really think pretty hard before adopting these data. Ignoring the above mentioned references, all the rest seem to predict things pretty closely. It is the plot of dimension versus z-score above that I think shows the most interesting data.
For the given "high BMI-for-age" patient, the Dallaire multivariable equation predicts the smallest mean aortic valve diameter. For that particular "extreme" patient, the predicted mean values are (excluding Daubeney and Pettersen):
| Reference | Predicted Mean |
|---|---|
| Dallaire: | 20.25 |
| Gautier: | 20.59 |
| Colan: | 22.31 |
| Warren: | 21.16 |
| Zilberman: | 20.64 |
By itself, a lower predicted mean will definitely address the issue of lower calculated z-scores for the higher BMI-for-age patients.
To wit, if we use the Dallaire predicted mean value of 20.25mm, each of the BSA-based references (again, excluding Daubeney and Pettersen) predict the following z-scores:
| Reference | Z-score |
|---|---|
| Dallaire: | (0.00) |
| Gautier: | -0.17 |
| Colan: | -0.89 |
| Warren: | -0.42 |
| Zilberman: | -0.15 |
Granted, the authors admit that a bias still exists in patients with BMI z-scores >2, but that this effect is at least attenuated as compared to the bivariate models.
N.B.: I included the lean body mass z-score equations (three term polynomial) in the plots even though the manuscript reveals that they did not perform as well as the multivariable polynomial model. I was hoping that something dramatic and unexpected would reveal itself, but alas nothing terribly obvious comes to light. I don't think we should give up on using LBM as a scaling variable, but based on the Dallaire et al. data in this article, the theoretically superior LBM model might be outperformed by a more practical and simpler(?) multivariable model.

